Imaging flame chemistry in two dimensions
What can we learn by imaging flames?
|
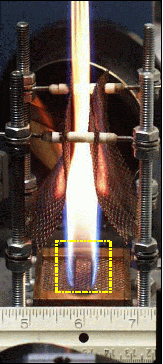
| Figure 1. Laboratory Wolfhard-Parker flame in normal gravity. The yellow box is the 1 square inch region imaged below. |
The detailed nature of a flame, even a simple candle flame, is still not fully understood. To fully understand flames, one must unravel both the chemistry of the flame and the ways in which the chemical energy of the flame causes gases to the transported. Ideally, the interaction of chemistry and transport processes would be studied using three-dimensional measurements of gas concentration, temperature, and velocity.
However, in studying flames in a normal gravity environment (on Earth), some basic processes within the flame are masked by the effects of gravity. One of the largest effects of gravity is the motion of the hot air within the flame due to buoyancy: the hot rises and is replaced by cooler air. This buoyant motion overwhelms all other modes of mass transport and has an important role in heat transport. (A simpler example of this phenomenon is a hot air balloon, which rises due to the hot air in the balloon that is less dense than the surrounding air.) To remove the effects of buoyancy, experiments can be conducted in a microgravity environment. (Microgravity is the term used to describe a near weightless condition, in which the effects of gravity are reduced by one thousandth.) The advantage of performing experiments in microgravity is that the combustion chemistry is identical to that in terrestrial systems, but with the buoyant transport "turned off." This permits a more detailed examination of the underlying flame chemistry and transport processes.
There are three practical ways to achieve microgravity. The longest duration, and lowest apparent gravity is achieved on board spacecraft orbiting the earth. This includes the space shuttle and the International Space Station, which will have a dedicated experimental combustion facility. Other methods for achieving microgravity require placing the experiment into free fall. (Object in free fall are all falling at the same rate relative to other falling objects, so that the objects appear to be floating in weightlessness.) In one approach, a research aircraft flies parabolic trajectories, which provides 10 - 15 seconds of microgravity. In the other approach, the flame and the associated instrumentation are dropped eight stories down a shaft, providing 2.2 seconds of microgravity.
Flame Imaging
To aid in the understanding of flame chemistry, Southwest Sciences has been conducting research to image gas concentrations within a diffusion flame using laser-diode based spectroscopy. The goal of this project is to quantitatively image gas concentrations over a large field of view (1 inch x 1 inch) within the flame. Initial efforts have focused on imaging water vapor in a two-dimensional diffusion flame. Future experiment tasks include performing imaging tests in microgravity and comparing the results with normal-gravity data.
Two-dimensional Diffusion Flames
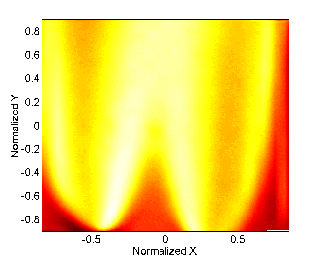 |
| Figure 2. Image of water vapor in the one inch square shown in Fig. 1 |
The burner shown in the figure is a Wolfhard-Parker slot burner, which creates a two-dimensional diffusion flame. (The term "two-dimensional" implies that any two vertical �slices' of the flame would be identical.) The fuel, methane in this case, flows from the inner channel in the base of the burner, and a co-flow of air flows from the outermost two channels. The term �diffusion flame' implies that the fuel and oxidizer (air) gas streams mix together in a chemical reaction zone by mass diffusion. The ruler in the image gives the relative scale of the burner and the flame. The metal screens along the side of the burner prevent the flame from oscillating due to natural convection air flows. The superimposed yellow box near the base of the burner indicates the region scanned by the water vapor absorbance measurement system.
The visible flame produced by the Wolfhard-Parker slot burner is shown in the burner image (Figure 1), and the water vapor absorbance image for the region outlined by the yellow box is shown in Figure 2. The X and Y scales are from -1 to +1, which is the normalized coordinate system; the physical image size is approximately 1 inch x 1 inch. The absorbance image shows regions of high absorbance (white) and regions of low absorbance (dark red). The dark regions at the far left and far right sides of the image show that there is little hot water vapor present in the ambient air. The dark triangle at the bottom of the image indicates that there is little to no hot water vapor present as the methane enters the combustion region. The white, inverted "V" shaped region in the central region of the image indicates the presence of a much larger amount of hot water vapor that is being produced within the flame. The two dark bands on either side of the high absorbance region correspond to the locations of the air co-flow The Wolfhard-Parker slot burner creates a very steady flame. However, this flame can be disturbed to produce changes in the flame shape.
Water Vapor Absorbance Images - Animated Movie
Color scale | |
| Low water vapor | High water vapor |
|
| |
| Figure 3. The flame is perturbed by blowing from the left side. | |
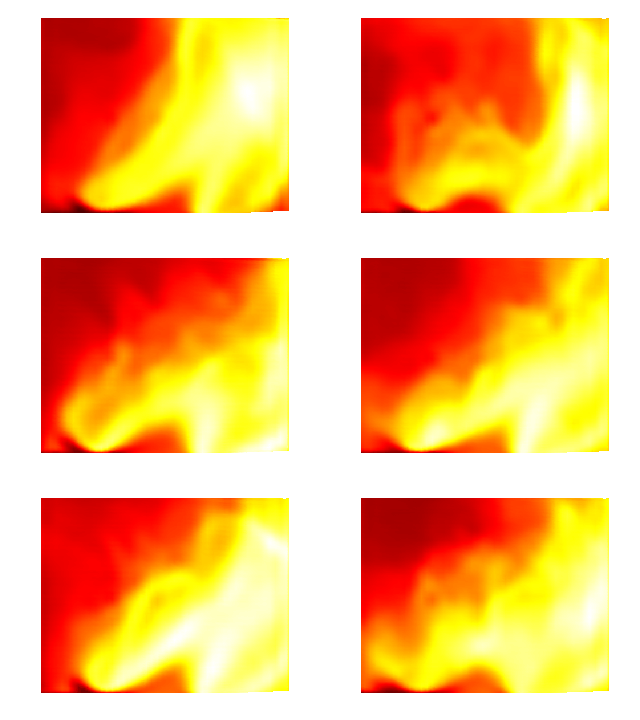
In this case, the diffusion flame is disturbed by blowing on the side of the flame, from left to right in the images. As in the previous image, dark regions represent low water vapor concentrations and bright (yellow-white) regions indicate high concentrations. The movie is an animation of ten images of the flame, continuously repeated. Each image is aqcuired in about 42 milliseconds. Note that this system is able to capture both small and large scale changes in the water vapor absorbance.
Water Vapor Absorbance Images - Transition to Low-gravity
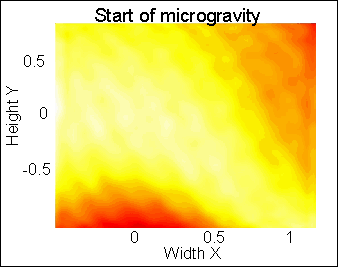
Low-gravity tests were performed in February 2000 with this imaging system using the 2.2 Second Drop Tower at NASA Glenn Research Center. These images show a comparison of a normal-gravity (pre-drop) and low-gravity water absorbance images. Due to an alignment problem, the scan region was not centered on the fuel inlet, but shifted slightly to the left. As in the previous images, white (bright) regions correspond to the highest optical absorbances, dark regions the lowest. At (t=0) the flame is in normal gravity. As time progresses, the flame transitions from normal-gravity to low-gravity. The transition to microgravity causes the flame to thin and lift away from the burner, as shown by the shift in the location of the strongest water absorption features. These are the first two-dimensional images of species absorbances in microgravity. An animated GIF "movie" (1.16 Mb) shows the flame in transition from normal-gravity to microgravity. The movie is an animation of 26 images of the flame, continuously repeated. Each image is acquired in about 42 milliseconds.
 |
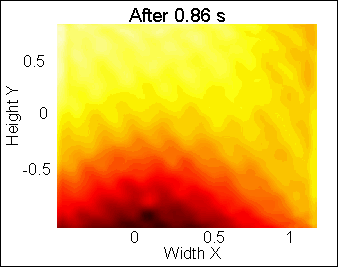 |
| Figure 4. Water vapor map just after releasing the flame, which initiates a 2 second period of microgravity. | Figure 5. Water vapor distribution after 0.86 seconds in microgravity. |
This research is sponsored by NASA through the NRA program at the Microgravity Science Division. For additional information, contact Alan Stanton.
Contact Information
e-mail info@swsciences.com


